Stromfee.US · arbitrage levers · revenue transparency
D3
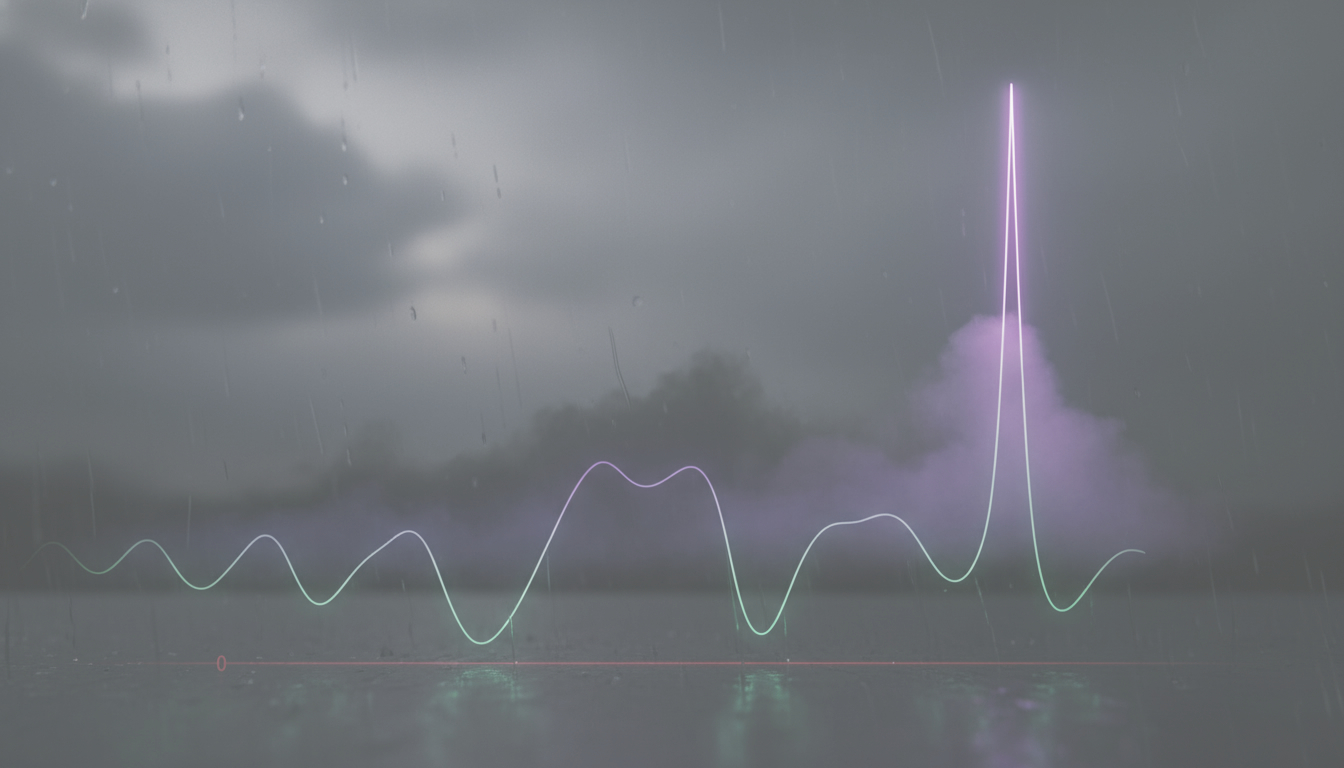
The raw hourly day-ahead LMP curve at CAISO SP15 for the most recent trading day — red zero line: below it, prices are negative.
This shows the CONCRETE entry points: the midday solar trough (often negative) to charge, the evening net-load peak to discharge. The duck curve is the US version of what German batteries trade — same physics, different hours.
US market roles, cleanly separated (FERC market design).
Timing tool: exactly these lows and highs are where buy/sell orders land.
Sees whether the day offers enough spread for an economic cycle.
Understands the volatility the return lives on.
The LMP is market-wide; utility and ISO do not trade it.